

Building a Partner Big Idea - Part 2 - The Two Line Model
The TLM is the engine of a startup M&A thesis - here's how to build one

The MBP centers on the Partner Big Idea (“PBI”). This three part series is a deep dive into their development.
Part 1 (read Part 1 before reading this Part 2): Opportunity + Methodology + Execution
Part 2 (this part): Economics + Two-Line Model (“TLM”)
Part 3: Market Leadership Positioning (“MLP”) + value framework + setting up the right offer
As I said in Part 1 this is a fictional scenario. Any overlap with happenings in the real world is coincidental. Also, I’m going to try to distill the development of a fictional startup M&A thesis down to its essence, so I’ll be making all kinds of simplifying assumptions and skipping over any number of details. What I want to transmit to you is the “feel” of how these things go, so that you have a head start in handling the situations that present themselves to you.
The PBI
As a quick recap of Part 1 we have BigResearch, a large diversified research company that studies complicated things for giant clients. DocT3c, a startup working on advanced AI for language processing.
Together they’ve developed the framework for a powerful PBI: Aligning key market forces; accounting for BigResearch’s major concerns; and defining how best to leverage DocT3c’s technology and expertise.
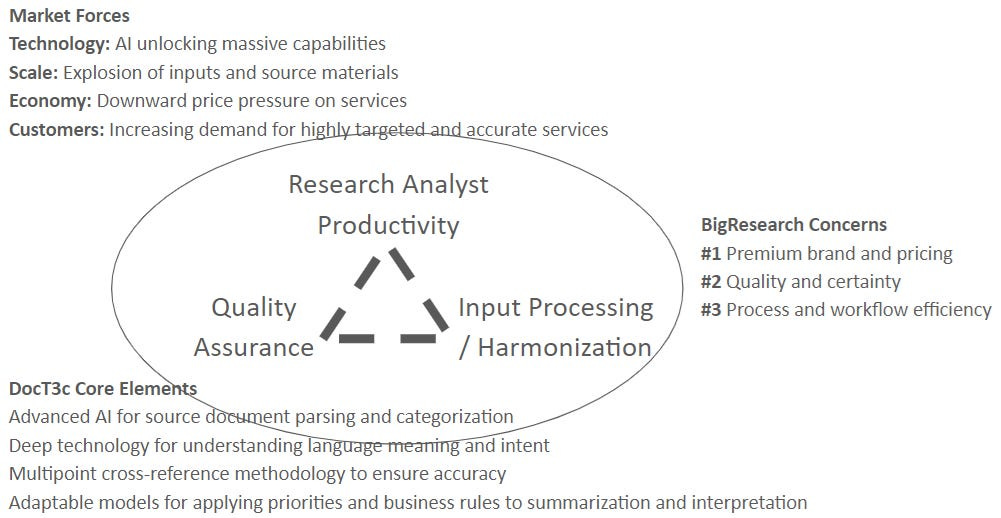
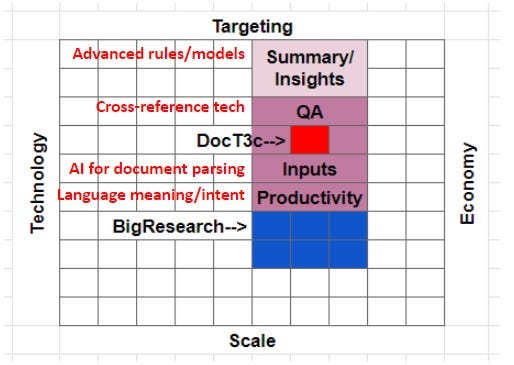
DocT3c is catalytic to BigResearch’s unlocking of the power of AI. They’ve mapped out a long-range and far-reaching strategy. In short, they’ve created a lot of purple boxes - with DocT3c’s red box right at the center.
Diving in on the Economic layer of the PBI
Beyond the Opportunity layer of the PBI, DocT3c’s CEO has artfully facilitated the initial framing of the Method and Execution layers. What’s left is the final layer of the PBI: Economics.
It’s becoming clear that there are two major areas where these advanced AI capabilities will manifest for BigResearch: 1) increasing the efficiency of project delivery, and 1) acquiring new projects. Both of these areas leverage similar aspects of the underlying product strategy, but they will manifest in slightly different ways. In fact, even though the initial thinking was that improving project delivery efficiency was the highest priority, it’s turning out that the biggest early gains are likely to be made in enhancing BigResearch’s ability to win new projects. As the conversion progresses, and the big idea layers continue to develop, DocT3c’s CEO realizes that it’s time to articulate the underlying economic model for how this PBI will impact BigResearch’s business. It’s time for the TLM.
But before we follow DocT3c CEO's efforts, let’s do a deep dive on what a TLM is and how to approach one.
The Two Line Model (“TLM”)
The TLM is the parallel economic model designed to illuminate the impact the PBI will have on the potential strategic partner’s (“PSP’s”) business. One line of the model shows how the strategy will unfold without the startup. The other line shows how it will unfold when boosted by the startup.

The startup is more adept at leveraging these new technologies. They are also further along in understanding their application. As such the growth curve of the PBI with the startup starts sooner and goes up faster. Without the startup the PSP will have to start later and execute less effectively. Technical expertise, market experience, time-to-market are all critical. So starting later, with clunkier tech, and a weaker team, translates into a tremendous loss of value for the PSP.
Beyond the internal benefits of starting sooner, there are also external benefits. By getting to market first the PSP can claim the market leading position, edging out competitors.
Collect data when it’s easy
You’ll need the inputs in order to build the TLM. Ideally you’d get these inputs directly from the PSP. However, as PBI’s start to form, and excitement starts to build, the potential of a partnership or acquisition negotiation appears on the horizon. The PSP will often become hesitant to share too much info lest that info be used against them in said future negotiation.
Anticipate that you may someday need to build a TLM long before the day comes that you need to do and collect data long before a potential negation is on anyone’s mind.
Naturally the critical data elements may not be exactly clear from the start, and they will be contextual to each PSP/PBI context, but you can almost always make general guesses around the big economic levers of a PSP’s business. A few safe bets for data collections are areas like:
Number and types of customers
Forms of monetization and pricing
Retention and churn dynamics
Sales cycles and conversion rates
Unit economics and core cost drivers
Implementation, and integration requirements
Delivery and support resources
You don’t need to get all of this in one go. As you work your way through early conversations you can almost assuredly smurf up an enormous amount of information by casually asking pointed questions. Arming yourself with this information will not only enhance your understanding of the PSP’s business and priorities, but it will also set you up to build a kickass TLM.
TLM KISS
As the old saying goes “keep it simple, stupid.” My version of this as it relates to startup M&A is that if it doesn’t make sense on a napkin, you probably don’t have a deal. Distill your TLM down to as few moving parts as possible. You don’t want a lot of clutter in the model. Clutter will confuse the conversation and significantly degrade the impact.
Ideal elements are ones that are: 1) core economic drivers of the PSP’s business (or potential business); 2) significantly impacted by the PBI; and 3) linkable to impacts your startup will make. These are the jackpot variables and each input may not hit all three but wherever you can, you’d like them to!
Strive to keep the TLM simple. When you do run into something you feel it’s important to expand upon, do it in a supporting sub-model or analysis document. The TLM is the top level thinking, but it doesn’t have to be the only piece of work. If you need to expand on an input or variable then do so by referencing another piece of work. This will keep the TLM from becoming overcrowded, while also displaying the depth of your thinking.
The TLM should focus on the core elements of the PBI and not extend too far into adjacent arenas. You also don’t want to look too far into future potential opportunities. You can discuss adjacencies and long-range potentials as qualitative elements in supporting materials. As I said above, the TLM is the napkin-math for the core aspects of the PBI.
KISS.
The start of a conversation
There are times when the relationship between the startup and PSP is so collaborative that developing the TLM is a joint exercise. But, more often than not, you’re probably going to be building the first version of the TLM without direct help from the PSP.
You want to build the TLM in such a way that it starts a conversation about the enormous economic impact of this PBI. To accomplish this in the least threatening way possible, you want to design the TLM in such a way that it can be handed to the PSP’s team, and they can play with the inputs. Framing it as a very rough draft, a thinking tool that needs their feedback. They may call you crazy, but the impact of the PBI, and the TLM, will start to seep into their thinking.
It’s also potentially the case that you aren’t able to develop a full blown TLM, the numbers may just be too vague for you to create a quantitative business case. In this circumstance you still want to create some form of framing of the economic implications of the PBI. Even if the framing is broad, there needs to be an articulation of the impact the PBI will have on the PSP, and of your importance to it. Make your case qualitatively if you can’t make it quantitatively, but still make sure to make your case.
Fortunately for DocT3c the inputs are clear, and the CEO has collected what he needs to build the first draft of a compelling model.
The TLM for BigResearch
DocT3c’s CEO has been gathering data points throughout the PBI development process. He’s made a point of trying to discover insights into BigResearch’s view of the market, their sales funnel, and project execution.
With new project acquisition emerging as the top priority (and improving project execution efficiency following closely behind) DocT3c’s CEO begins to frame the TLM for BigResearch.
He has learned that projects are the core of BigResearch’s economic model. They see the typical project as being roughly a year long, with three or so consultants per project, billing around $85K per month (at an average of $200 per hour) - so in the range of about $1M per project per year.
DocT3c’s CEO also learned that BigResearch has around 600 projects running at any given time, which puts them at roughly $600M in annual revenue. BigResearch’s CEO has set the company’s BHAG target to be reaching $1B in revenue in the next five years.
BigResearch sees their current target market as representing 20K strategic research project starts per month. Further, BigResearch believes that by leveraging technology they can expand the types of projects they could serve, in time significantly increase the number of project starts on which they could bid.
Further, through this technology BigResearch can not only increase the number of projects they can serve, and on which they can bid, but they can also improve their win rate, and increase their revenue per project.
As it relates to improving the efficiency of project delivery. BigResearch sees this new technology as: 1) enabling their consultants to do more in less time; 2) enabling less expensive junior consultants to do the work of those at a senior level; and 3) increasing both the speed and quality of delivery.
Where to focus?
DocT3c’s CEO knows that for the TLM to be effective it has to be simple. He decides to focus on a few key growth variables: market size, sales funnel, and revenue expansion. He’s going to include some level of cost improvement on the project delivery side, but for now he’s going to handle this in a more aggregate way and not dive too deep into it.
Here are the big numbers he puts down as his starting point on the growth side:
Global Strategic Research Project Starts (Per Month): 20,0000
Percent of Projects BigResearch Bids: 1%
Percent Win Rate on Project Bids: 25%
Project Revenue (Per Month) $85,000
Current BigResearch Projects: 600
Project Length (In Months): 12
DocT3c’s CEO is going to use these numbers as the starting point for both the “Standalone” model and the “Combined” model. There’s no real reason to change these starting points for either model, as the starting point is-what-it-is in both cases.
What is going to differ between the two models is how quickly change happens. How fast can BigResearch expand the target market, bid on more projects, increase their win rate, and expand project revenue? The growth is going to be in the compounding impact of faster, technology-powered, improvement, not in a single step-function leap forward.
DocT3c’s CEO develops some estimates that he feels are pretty defensible for how BigResearch will evolve in their current standalone mode. For each of the key variables, the monthly rate of change looks like this:
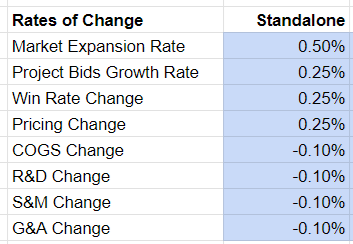
However, by moving quickly, acquiring DocT3c, and executing on the PBI, the rates of change for several key variables change at much faster monthly rate - more like this:

DocT3c’s CEO knows that he needs to tie each of these improvements back to tangible impacts his startup can make. So he creates a supporting document that outlines the impact the PBI (powered by DocT3c’s technology and expertise) will have on each variable. For example in the case of Project Bids Growth Rate he links the AI automation of bid research and preparation to an increase in productivity (and quality). He quantifies the time difference between the legacy, manual, way of developing bids and the new automated approach. It’s a strong link and the process improvements are hard to argue.
Putting this to work
DocT3c’s CEO builds out a simple model. The model looks out three years (by month) and has the Starting Point of key variables (column B), the Rate of Change (column C), and then how things look for that variable in the 36th Month of the model (column D).

(Spreadsheet note: if you download this spreadsheet you can edit various cells. On the Monthly tabs the cells that are shaded green are editable. The cells that are shaded blue are editable also, but edit them on the Summary tab (column L and M). I have these blue cells organized on the Summary tab so that you can quickly compare changes in the key variables at the aggregate level.)
You can see the full TLM model here:
Keep reading with a 7-day free trial
Subscribe to MBP.co - Startup M&A Insights to keep reading this post and get 7 days of free access to the full post archives.